Healthcare Project
Problem Description
One of the challenges for pharmaceutical companies is to understand the persistency of drugs as per the physician's prescription. This issue results in a bad impact on the pharmacies for all the categories; patients, physicians, and administration. However, the team of data scientists is capable of discovering the analyzing the dataset, and detecting the factors that are impacting the primary factor which is "persistency". By building a classification machine learning model, we will be able to classify the dataset and find the variables that affect the target variables "Persistency Flag".Business Understanding
In this project, our aim is to examine the persistency of drugs. To have a better business understanding, our aim is to understand our dataset deeply. We will examine the features to gather some more knowledge, we will find relationships between the features and their effects on our target variable.We will look at the demographics, clinical factors, provider attributes, and disease/treatment factors. Then our goal is to create a model to decide whether a given drug is persistent as per the physician’s prescription. To do that, we will do some feature engineering and decide which of the features affects the drug persistency. After applying different models, we will decide which model fits best to our dataset.
Project Lifecycle Along with Deadline
For working on the project, we decided to use the agile methodology, the reason we decided to use it, is because the agile approach can be quickly adapted by many different types of projects, such as marketing, universities, military, software, and industrial project, the ability of quick adaptation will be useful for us because we will be working in pairs to move faster, but in the same time, we need to have the ability to go backward in case of any errors or mistakes.For the deadlines, we will be working according to the same deadlines provided in Canvas and we will work to submit on time, but most importantly we will work to deliver everything before the final deadline.
Data Understanding
For this part, we created many visualizations to understand the dataset, we applied several inspecting functions such as head, tail, and shape. We looked at groups of people according to their region, age, race, and gender, we detected some issues like null values and outliers, and many more analyses.I will share some of the results here, but for the full document, you may check the full file in the GitHub link provided at the bottom (this part is in task 8).
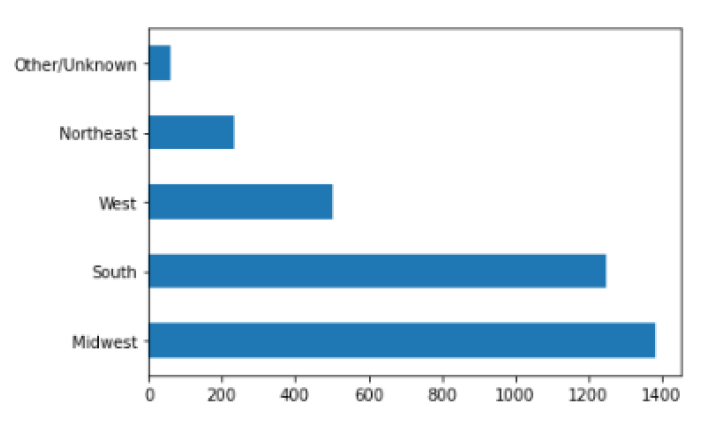
Examining the "Region"
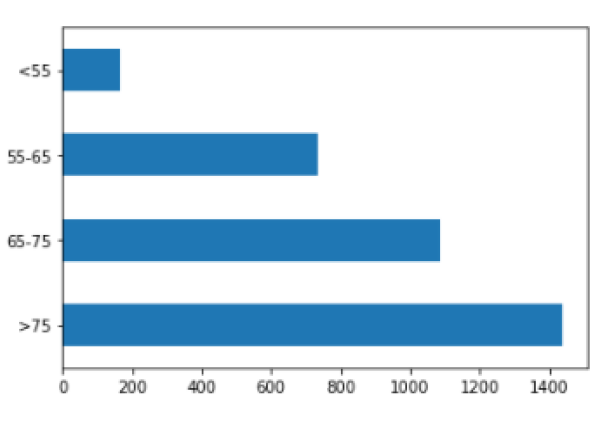
Examining the "Age"
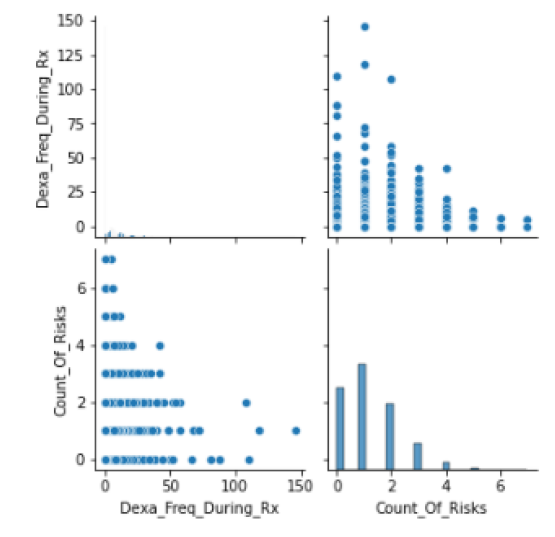
Examining the "relation between some numerical variables"
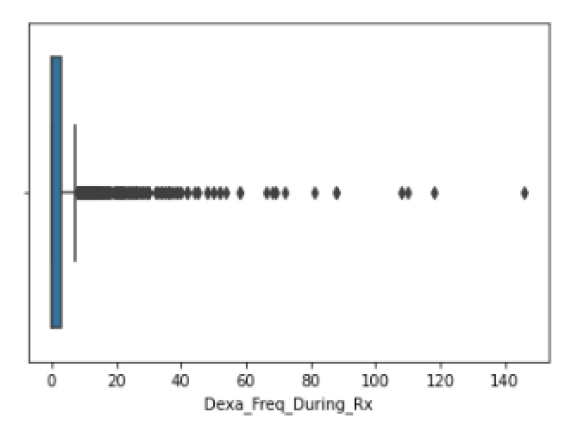
Examining the "Outliers"
Data Cleaning
For this part of the project, we worked on data cleaning, in the beginning, we saw many values as “Unknown” and to make the model perform better we had to remove them, the unknown values were in 4 columns which are:'Risk_Segment_During_Rx', 'Tscore_Bucket_During_Rx', 'Change_T_Score' and 'Change_Risk_Segment'.
Moreover, we cleaned the data using mean, median, and mode values, we decided which one to use according to the situation. We checked the outliers for the two numerical columns we had.
I will share some of the results here, but for the full document, you may check the full file in the GitHub link provided at the bottom (this part is in task 9).
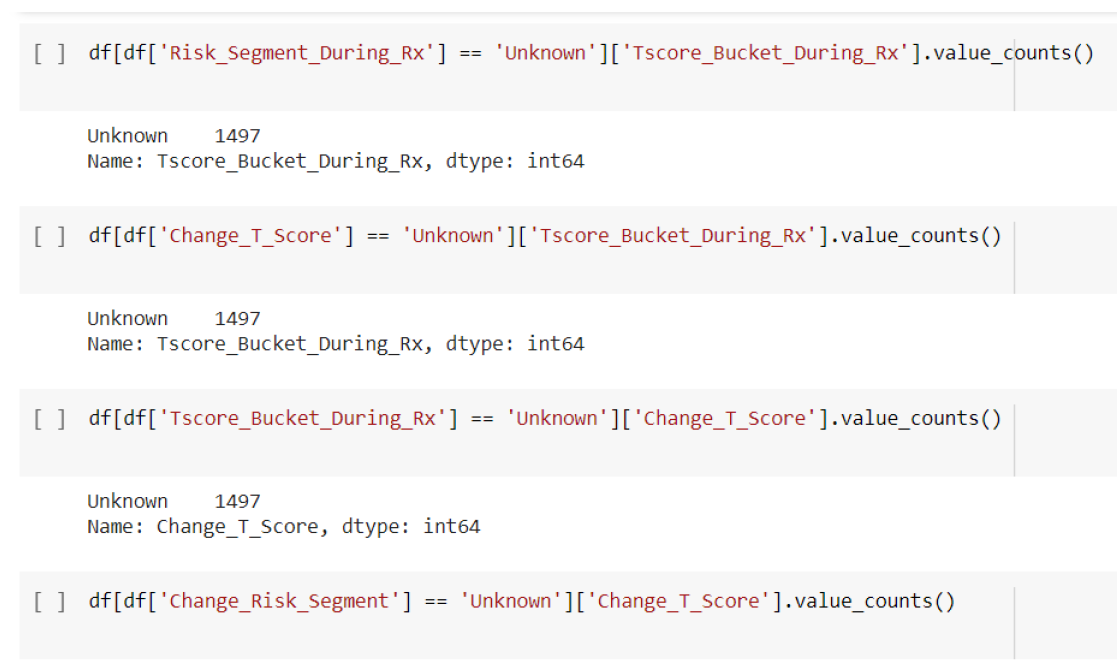
Checking the value counts of "Unknown"
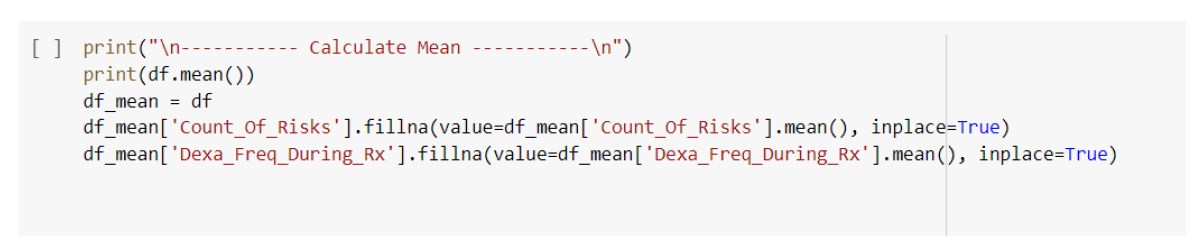
Replacing with "Mean" value
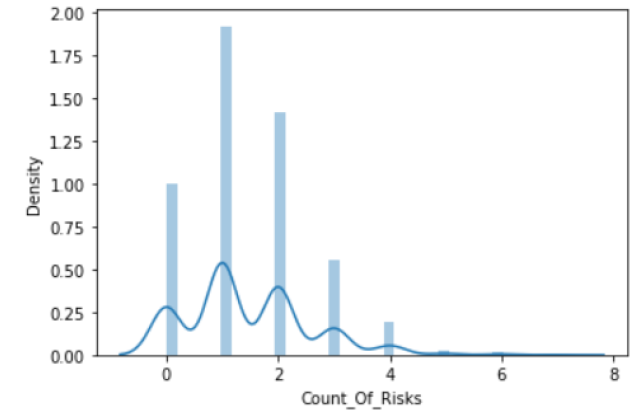
Checking for outliers
EDA Performed on Data
In this part of the project, we worked on the EDA (Exploratory Data Analysis), we started with background info about the project, then we worked on the EDA performed on data, and we concluded our work with recommendations. We took some of our previous work as we had to gather everything related to EDA this week.For the full document, you may check the full file in the GitHub link provided at the bottom (this part is in task 10).
Statistical Analysis
In this part of the project, we did similar work as before, we started with brief background info, then we did some statistical analysis, after that, we created some hypothesis tests and data visualizations, and finally, we gave recommendations.I will share some of the results here, but for the full document, you may check the full file in the GitHub link provided at the bottom (this part is in task 11).
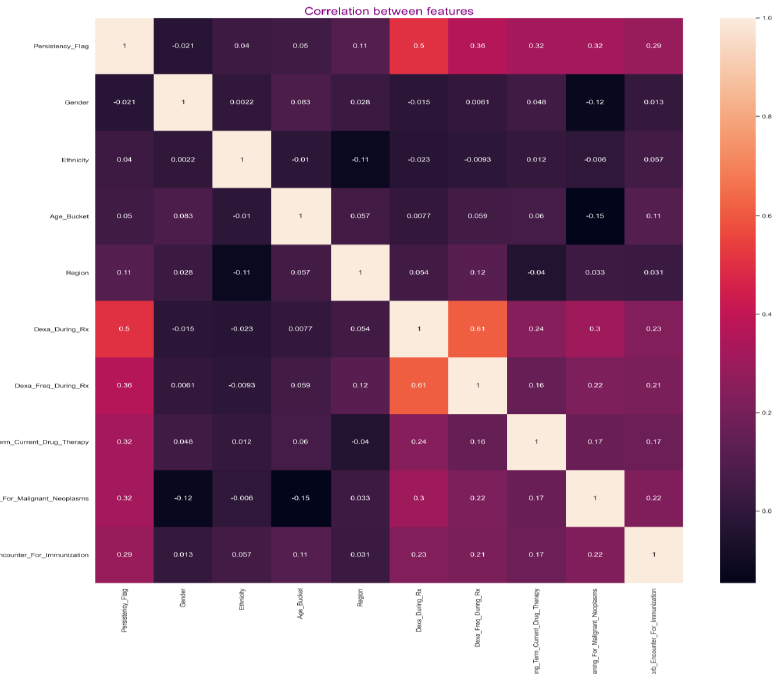
Checking the correlations
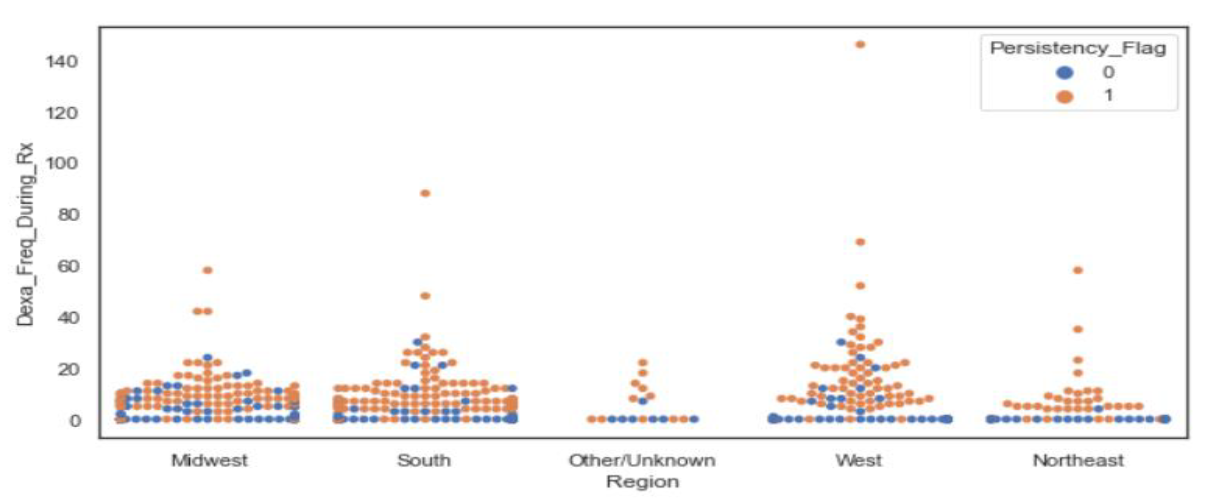
Checking the number of DEXA scans by each region
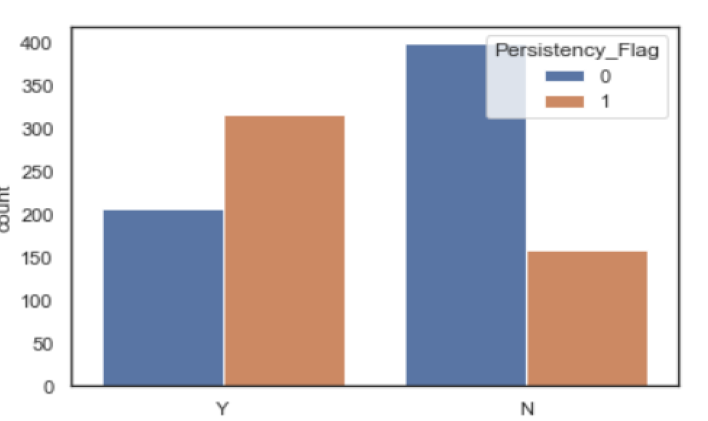
0 and 1 cases visualization
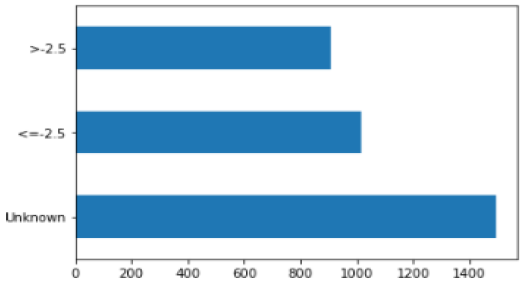
T-Scores during the Rx
Model Selection and Building
In the model-building stage, various regression techniques were used to classify the Drug Persistency of subjects based on the predictor variables.After preparing the features of the machine learning model to predict data by transforming categorical data into numbers, now it is the turn of the model building step.
To do this, we split the dataset into train and test set using Scikit learn library into 80% for training data and the rest (20%) for the testing, with training samples shape is (2739, 64) and the testing shape is (685, 64).
We used seven different regression techniques:
• Support Vector Machines (SVM)
• K Nearest Neighbor (KNN)
• Logistic Regression
• Multi-Layer Perceptron (MLP) Classifier
• Decision Tree
• Gradient Boosting
• Random Forest
In order to select the best model from seven models, we looked at the performance metrics used which are:
Accuracy, Precision, Recall, f1-score, Support and AUC.
Based on the previous analysis, we recommend using two top models which are almost close in terms of Accuracy to solve this problem:
• Gradient Boosting
• Logistic Regression
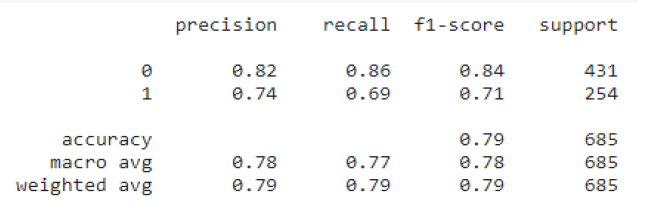
Results of Logistic Regression
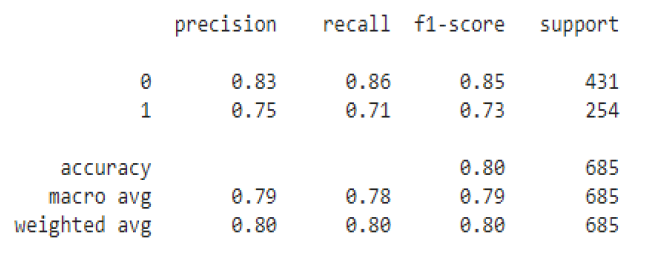
Results of Gradient Boosting
The best model that detects Patient Persistency, is Gradient Boosting with an Accuracy of 80%.
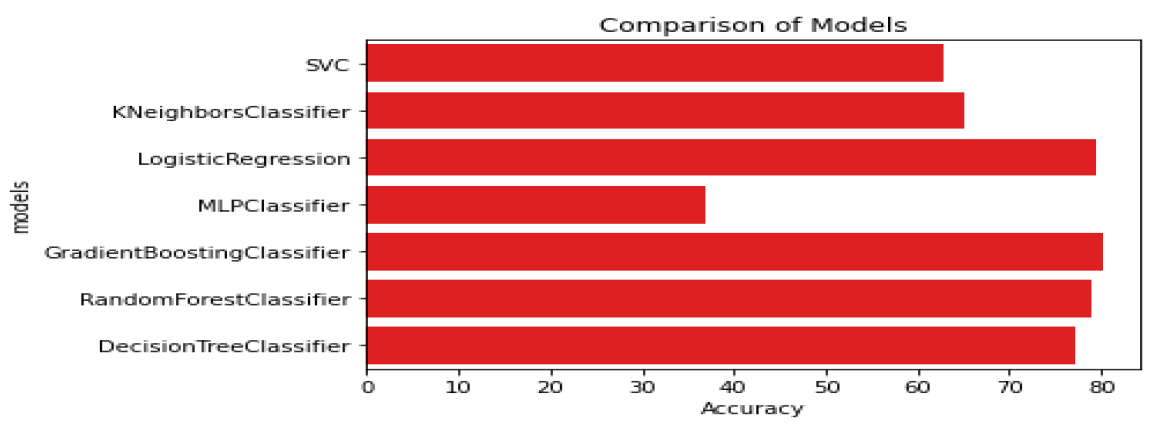
Comparison of models
ROC tells how much the model is capable of distinguishing between classes. Higher the AUC, the better the model performs.
This curve plots two parameters:
• True Positive Rate (TPR), which is also called recall
• False Positive
Rate (FPR)
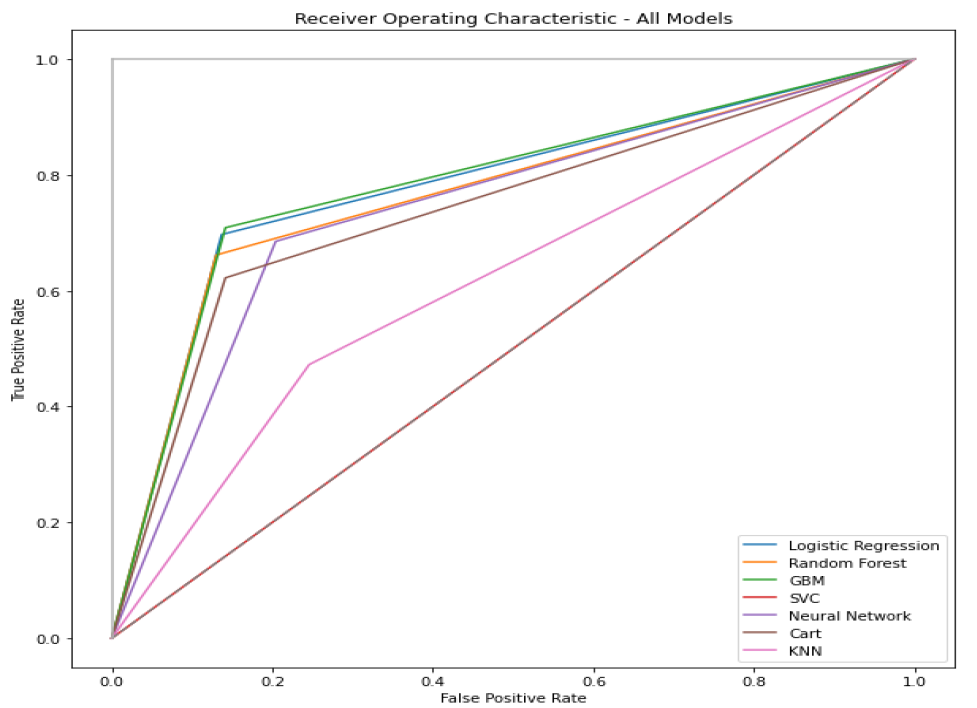
ROC curve comparison
Finally, we have compared their accuracy scores and we obtained the following:
• Gradient Boosting Model is the best fit model to our dataset with an accuracy score of 0.80.
• We can also apply Random Forest Model with an accuracy
score of 0.79.
• We can use the Logistic Regression model with an accuracy score of 0.79 and a cross-validated score with 10 splits of 0.78.
For the full document, you may check the full file in the GitHub link provided at
the bottom (this part is in task 12 and 13).