Kickstarter Projects Dataset
One of my favorite projects too is this one from "Data Science with Python" course, I worked with 3 of my friends on it. As it’s seen in the course name, this is a data science project and that’s why it’s one of my favorites, we used Python programming language and the framework was Spyder. In the beginning, we had to choose an idea to implement the data science topics on it. I decided the idea to be the kickstarter projects dataset, we took the dataset from the Kaggle website. Kickstarter allows businesses to share their products descriptions and ask people to pledge money to start full-scale productions.
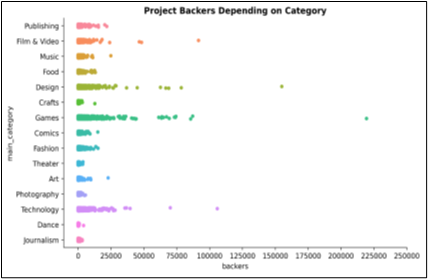
The dataset shows many attributes, such as categories, currencies, dates, states, goals, etc. The dataset shows the result of 321,616 unique projects in the year 2018. The purpose of this project was to analyze the effect of attributes
in this dataset on the project, and their success. Another goal was to make comparisons between those attributes and show how one affects another. For instance, how successful are projects that have music as their main category, and if
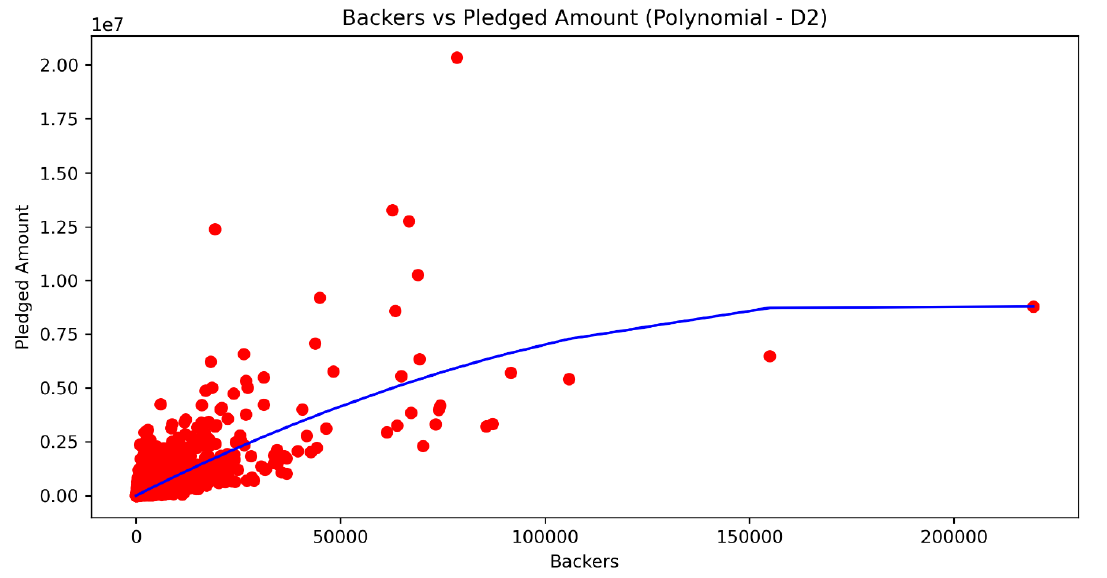
those projects that have a big goal fail most of the time or not? We planned to display the correlations for the dataset such as the correlations between successful projects and people’s pledged money and the correlations between the state
of the project and its country of origin. We also wanted to see if these correlations contribute to the project being failed, canceled, or suspended.
In this project, we did data preprocessing (formatting, cleaning, sample, encoding, summaries), data transformation (aggregation, scaling), feature selection, data splitting, modeling, and a lot of visualizations such as heatmap,
bar chart, stacked bar chart, pie charts, categorical plot. Our results were interesting, and they helped us to answer our questions, for example, we analyzed the distribution of success depending on goals, and the project's state (successful,
unsuccessful) percentage. This course wasn’t a must course for SEN but I took it because I love data science. Finally, we got 100 from this project.