Capstone Project
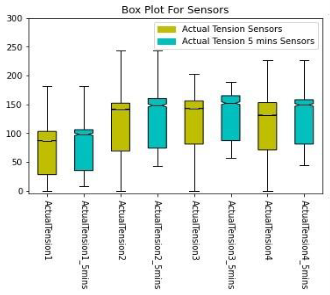
That's my "Capstone Project", without a doubt I can say this is the biggest project I worked on in my bachelor's degree, I worked with 5 friends, 3 of them are software engineering students, and 2 are electrical and electronics students. This project was a complete machine learning and data science project, the software team used Python programming language and Spyder framework, for the electrical and electronics team, they used MATLAB. As in the case of any machine learning project, we had to do a lot of visualizations to understand the data, which was consisted of more than 500K rows for each sensor (4 sensors total). We took the data from the P&G Gebze factory.
The purpose of this project was to implement a Machine Learning (ML) model that can predict the future breakouts in Proctor & Gamble (P&G) Gebze factory. For some reason, there were some unplanned stops occurring in the production
line in P&G Gebze factory. The problem was identified to be “Elastic Breakouts”. From this point, the idea of using ML emerged, with its ability to improve the computer algorithms automatically through experience, and with the ability
to make decisions and predictions without being explicitly programmed to do so, it was the correct choice to choose.
The main goals in this project are to:
1- reduce or even eliminate the unplanned stops occurs in the production line.
2- Provide significative action suggestions to the operation teams.
3- Ensure that the parameters
that affect each other are revealed.
To be able to achieve these goals, we had to make working plans, such as work breakdown structure, responsibility matrix, project network, Gantt chart, and risk assessment.
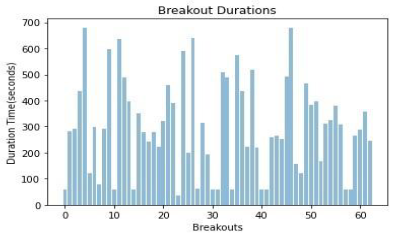
The graduation project is 2 semesters project, therefore in the second semester (materialization semester), we started with redesigning our data. Our data was not enough for prediction. We had an idea to cluster the rows and predict if
the production line had breakouts or not. This perspective was wrong since our main aim was to predict the breakout before it occurs. Therefore, we added a new column that shows when the breakout will occur, we called it “timeLeft” and
then started to predict it in different ways. After adding the new column, we worked again on data cleaning, preprocessing, feature selection, and feature extraction.
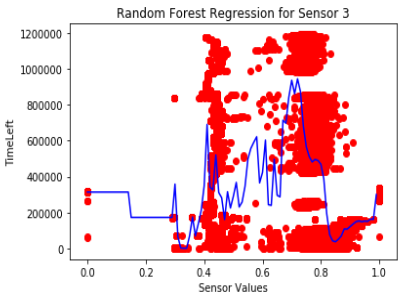
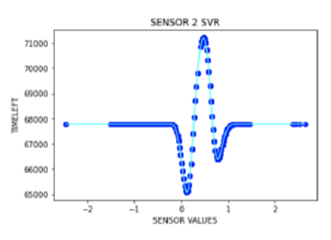
We used GridSearchCV to determine the optimal values of the models we implemented. We implemented several machine learning models, such as Decision Tree, KNN, Random Forest, XGBoost, MLP, etc., some of the models gave inaccurate results,
such as Lasso and Ridge models.
After getting our optimal model and parameter, we focused our work on it. All our models were Regression because the main reason for these models is to predict the breakouts (values), and it’s important
that we make a numerical estimate for this dataset rather than a categorical estimate.
We got several results from our models, such as, R Squared Score (RSS), Root Mean Squared Error (RMSE), Mean Squared Error (MSE), Mean Absolute Error (MAE), True Positive (TP), False Positive (FP), True Negative (TN), and False Negative
(FN).
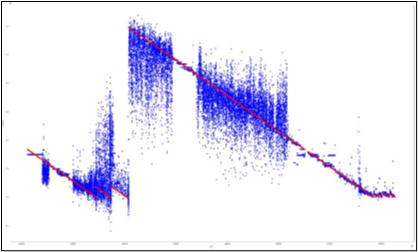
Eventually we were able to get some real predictions from our models and it’s quite accurate. As the time left for breakout decreases, the model clearly predicts it. There were some unclear predictions, but we handled them, and
the model was working in the end.